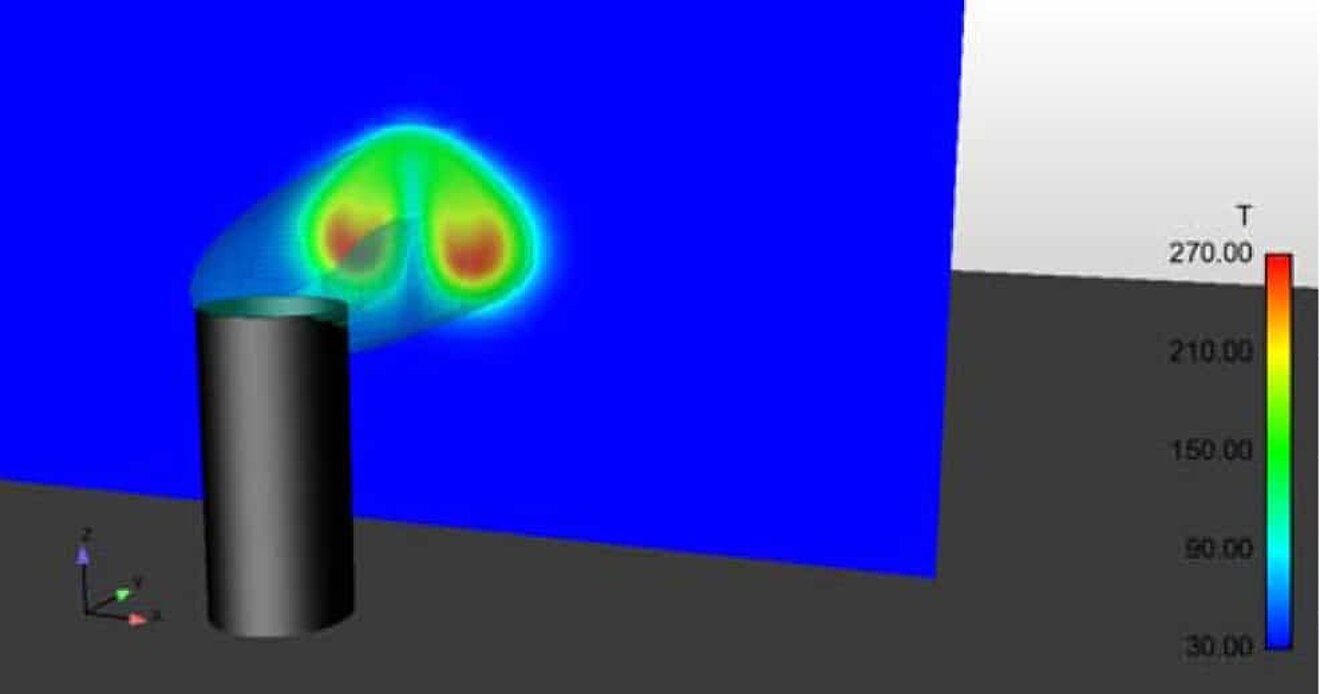
Flow and temperature profile around an exhaust stack
A typical task in the planning of e.g. chemical plants or refineries is the suitable positioning of high flares or exhaust gas stacks. When a hot gas stream exits, it mixes with the ambient air and is transported along with it. For the positioning of neighboring plants or buildings, it is therefore important to know how this hot exhaust gas stream spreads and at what distance from the high flare what temperatures occur.
One way to estimate this is to use analytical models. There are various models to determine the mixing of different gas streams with different temperatures. However, these usually provide useful results only for highly simplified configurations. Surrounding buildings, however, can strongly influence both the wind direction and the resulting wind speeds. By applying numerical computer models (CFD = Computational Fluid Dynamics), the flow field and the resulting temperature distribution can be calculated. This also allows the quick and easy investigation of different wind directions or wind speeds.

Task / Calculation
The example shown exemplifies the simulation of the mixing of a hot exhaust gas jet with a temperature of T = 1000°C from a stack with the ambient air in one plane. The exhaust gas volume flow is V = 160000 m³/h. The wind speed is w = 10 km/h.
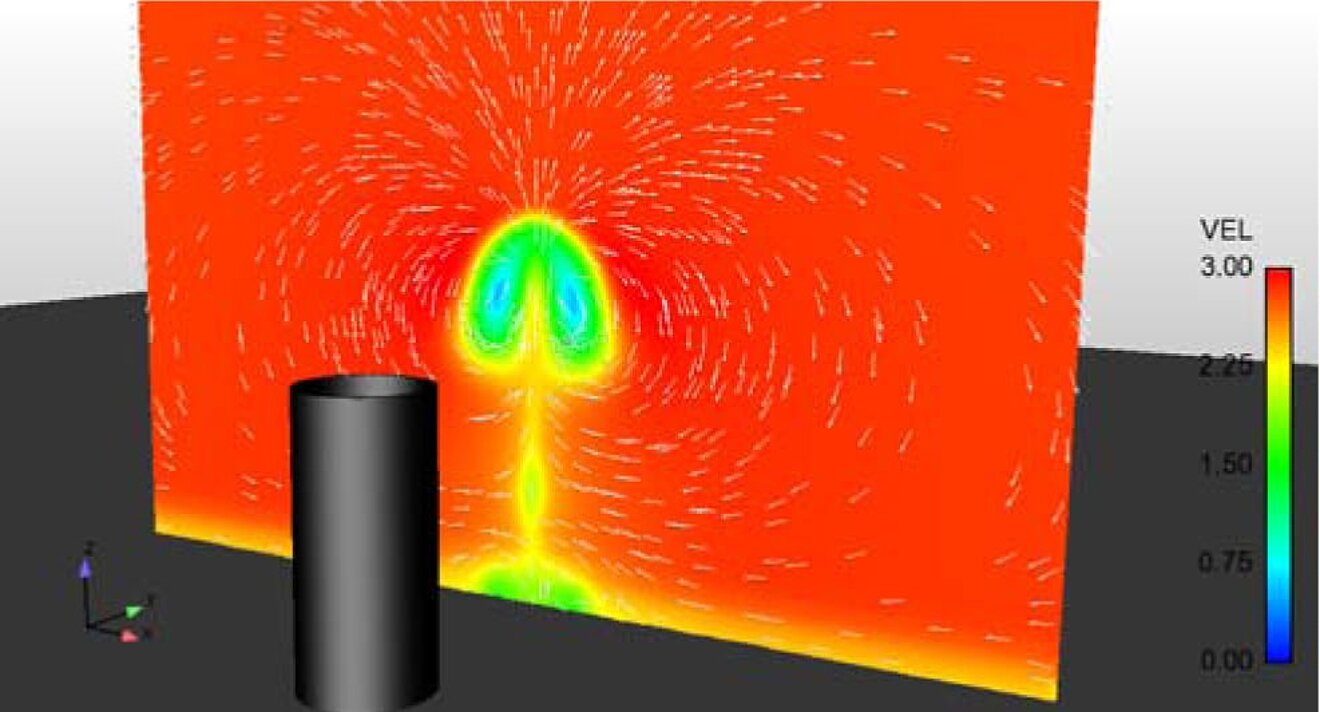
- The velocity distribution in a plane 10 m away from the chimney is shown on the first picture (see below).
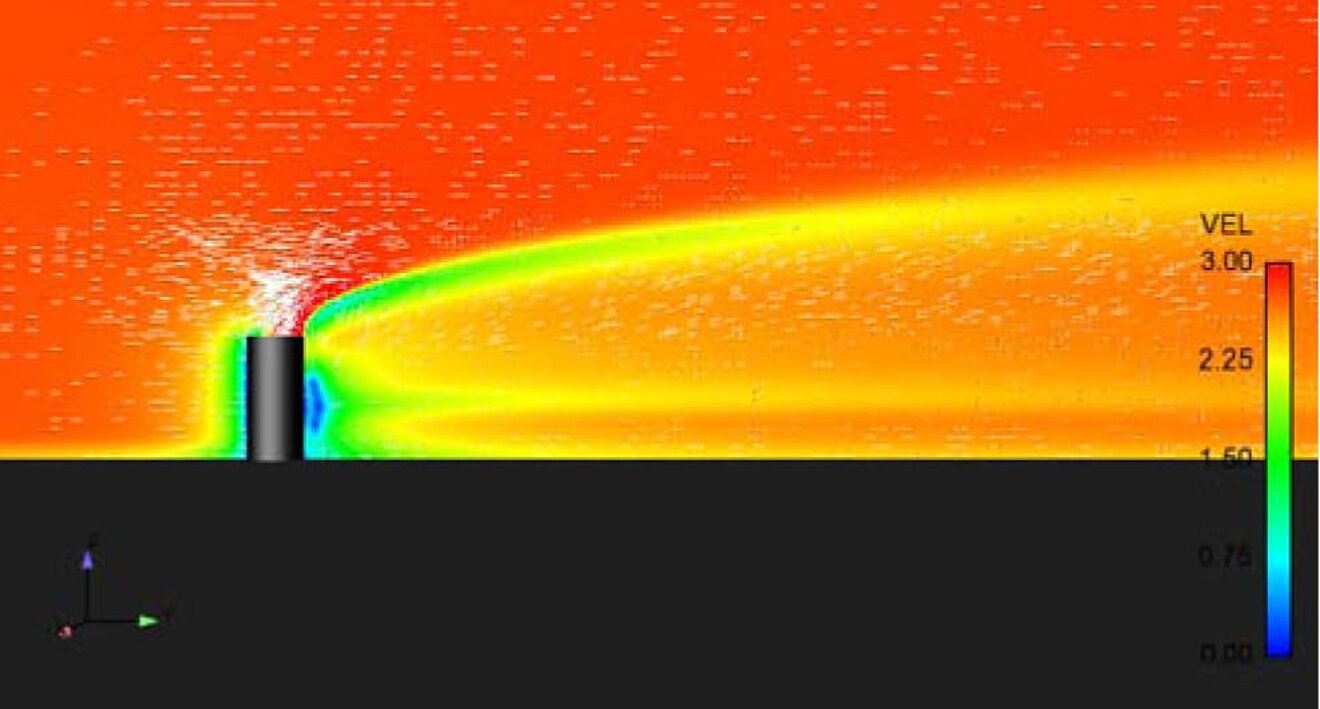
- The second picture shows the velocity distribution. The flow is strongly influenced by the chimney. There is turbulence in the wake.
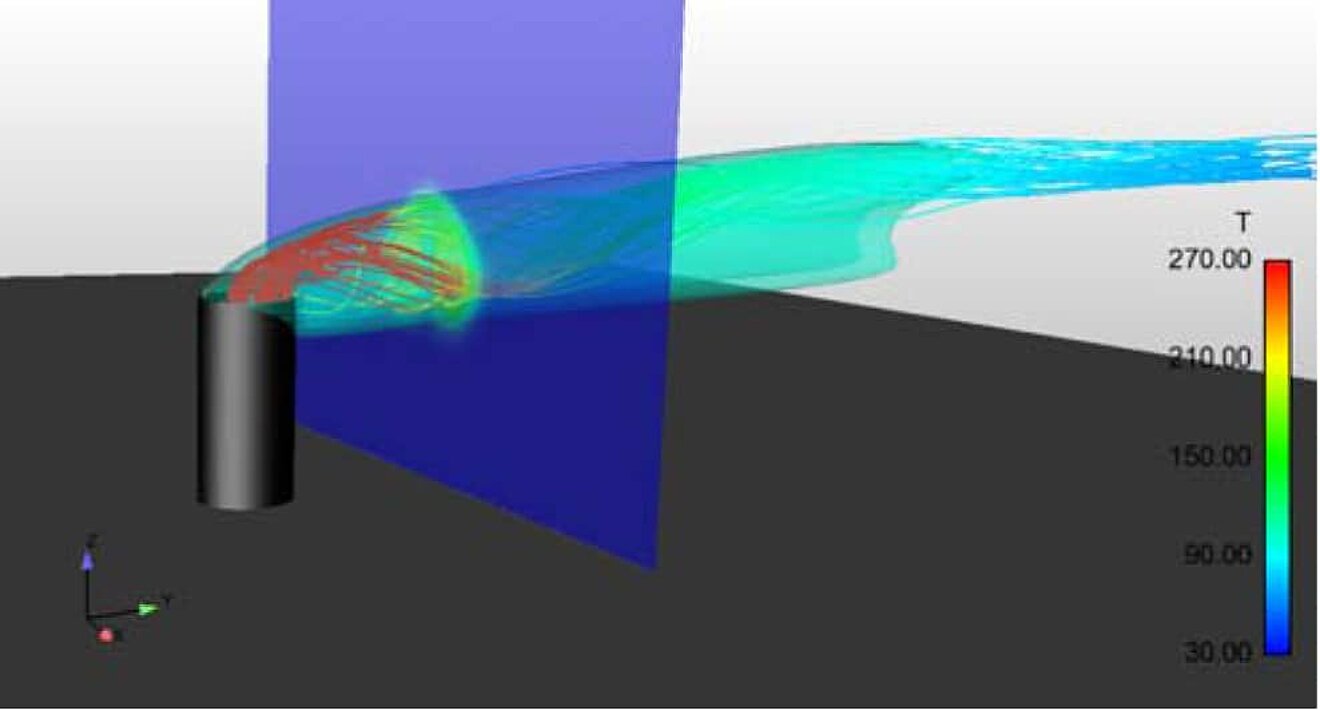
- The third picture contains streamlines of the exhaust gas flow, which are colored with the temperature. The transparent isosurface is an isotherm with T = 100°C.
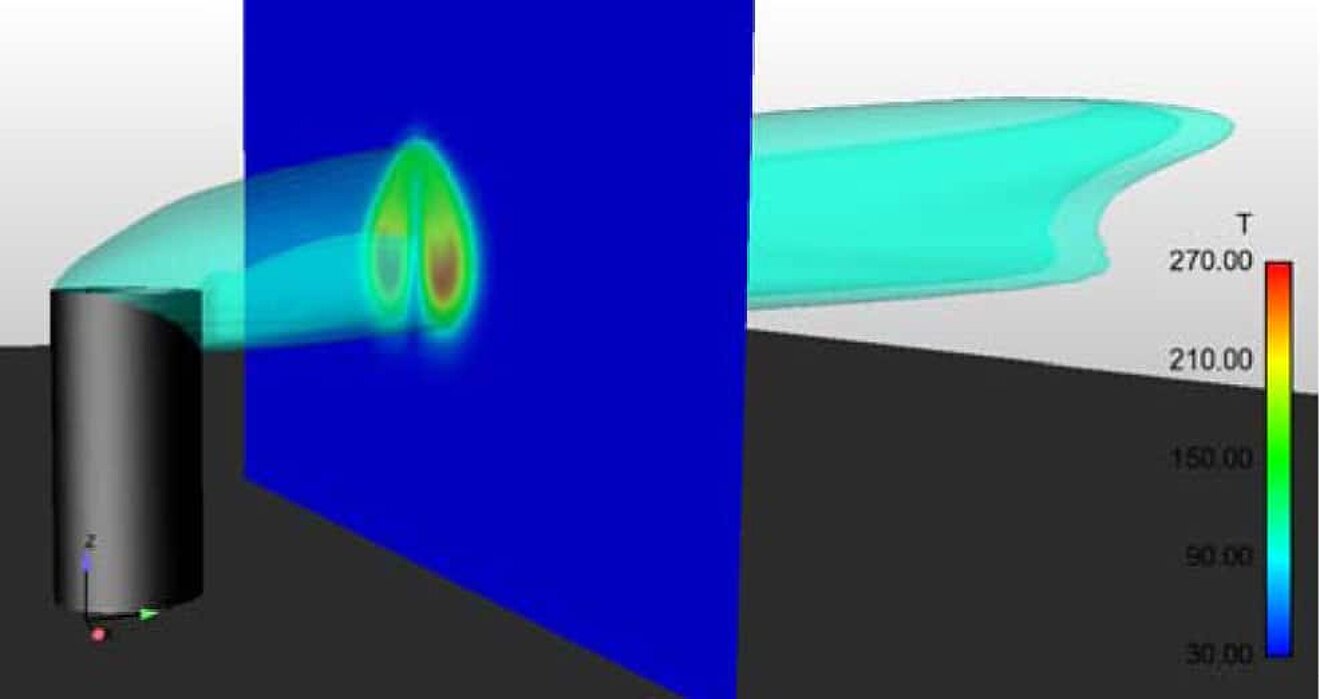
- The isotherm is shown again in detail on Fig. 4. Under these boundary conditions, the isotherm of T = 100°C extends about 53m.
- Figure 5 shows the temperature distribution in a plane 10m away from the chimney. Here, a maximum temperature around T = 270°C still occurs.
Results
These results allow conclusions to be drawn as to where a building can be erected in the vicinity of the chimney or whether, for example, the chimney must be built higher. The model presented here is kept very simple. An increase of the complexity by considering the terrain topology or by surrounding buildings is possible without further ado.
